
續前一篇「JavaScript學習路-(16)Console-2」
inspect()
inspect 是檢查的意思,它可以在打上指令後馬上跳到要查詢的地方去。
搭配之前學到的 $() ,先找到要的元素….
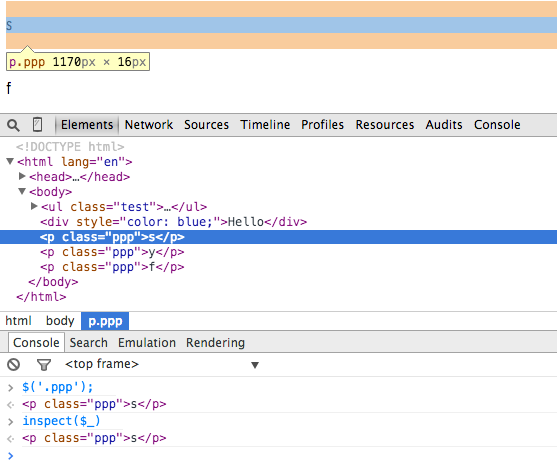
$('.ppp');
Console 會顯示出要找的 html
再來打上 inspect($_) ,
Console 會直接 跳到 Elements 的頁籤告訴你想要的元素在哪兒
不過跳頁籤的功能似乎只能用於 $() ,
因為用 $$() + inspect($_) 只會 repeat $$()的結果。
$0, $1, $2, $3, $4
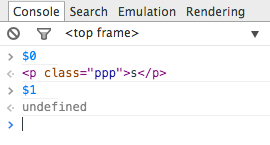
Console 可查詢最近叫出來過的元素,直接打上 $ + 數字即可。
因為 JavaScript 都是從 0 開始算,所以第一個打 0 也是很正常滴~
不過如果最近沒查什麼就會像下圖安捏(好像廢話xD)
我個人還是偏好點放大鏡去找元素,或者在該元素右鍵 –> 檢查元素比較快呢
monitorEvents()
監聽某事件。例如要監聽視窗縮放就這樣寫:
monitorEvents(window, "resize");
如果要一次監聽多個事件:
monitorEvents(document.body, ["mousedown", "mouseup"]);
監聽某個 ID 事件:
monitorEvents(object[, events]);
不監聽事件:
unmonitorEvents()
以下是 monitorEvents() 有支援的事件:
| 事件類型 | 事件 |
|---|---|
| 滑鼠 (mouse) | “mousedown”, “mouseup”, “click”, “dblclick”, “mousemove”, “mouseover”, “mouseout”, “mousewheel” |
| 鍵 (key) | “keydown”, “keyup”, “keypress”, “textInput” |
| 觸碰 (touch) | “touchstart”, “touchmove”, “touchend”, “touchcancel” |
| 控制 (control) | “resize”, “scroll”, “zoom”, “focus”, “blur”, “select”, “change”, “submit”, “reset” |
profile() + profileEnd()
在 CPU 建立 Profile。
如果直接打上 profile() 然後 profileEnd(), Console 會顯示:
profile()

Profile 'Profile 1' started.
profileEnd()

Profile 'Profile 1' finished.
如果要幫 Profile 命名則:
profile(“名稱”) + profileEnd(“名稱”)
Profile 可以建立群組,可如下所示,打一樣的名稱, Console 會視為群組包起來
profile(‘test’);
–> Profile ‘test’ started.
profileEnd(‘test’);
–> Profile ‘test’ finished.
profile(‘test’)
–> Profile ‘test’ started.
profileEnd(‘test’);
–>Profile ‘test’ finished.
巢狀寫法可以一次建立多個 Profile:
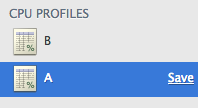
profile("A");profile("B");

profileEnd("B");profileEnd("A");
因為 profileEnd(“B”) 比 profileEnd(“A”) 早完成,所以會先建立 Profile B
如果把 profileEnd(“A”) 先出來就會跟上圖相反哩
profile(“A”);profile(“B”);profileEnd(“A”);profileEnd(“B”);
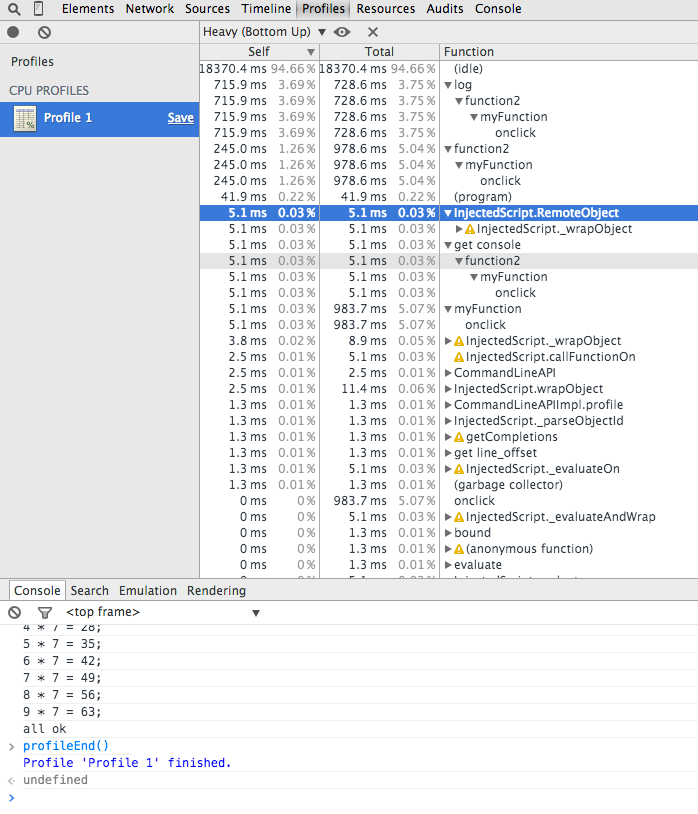
原本不清楚 Profile 的用處,一問才知道這可以觀察函式運作時所吃掉的資源比例。
不過如果太快的東西似乎沒出現,可能短到看不見了,
圖示的範例其實寫了五個,但 Profile 只出現一個。
本文同步發表於 http://ithelp.ithome.com.tw/ironman7/app/article/dev/recent/10158288